!!! IMPORTANT !!!
This page is partially outdated.
Since the publication of this page, we developed an improved MCDS Trace Importer with powerful new features and improved usability.
Click here to visit our latest page on this topic.
Safety & Performance
When it comes to functional safety, run-time performance plays an important role. Active functional safety devices rely on measurements performed by sensors, post-processing of the measured data including sensor data fusion, and corrective actions performed by actuators.
Hence functional safety is not only a matter of clever algorithms that process sensor data and calculate appropriate responses; it is equally important to meet maximum end-to-end response time requirements all the way down from sensors to actuators, across ECUs, hypervisors and buses.
Analyze Run-Time Behavior on Infineon AURIX
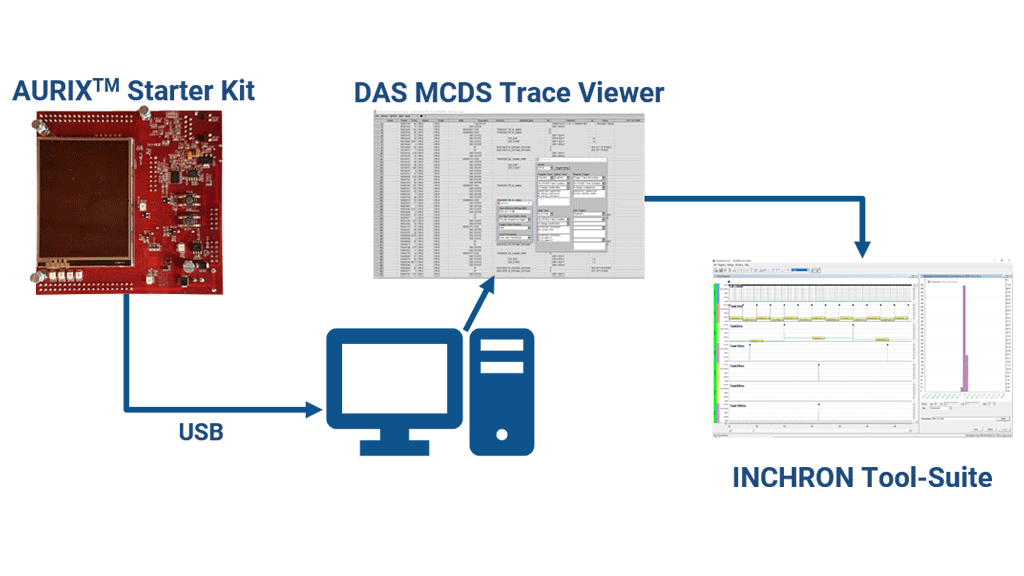
The INCHRON Tool-Suite seamlessly integrates with the Infineon AURIX platform via Infineon’s DAS (Device Access Server) tool interface. For comprehensive manual and automated run-time performance analysis on Infineon AURIX microcontrollers, there is no need for external trace hardware anymore. All you need is an AURIX evaluation board, a standard PC, Infineon’s Multi-Core Debug Solution (MCDS) Trace Viewer that comes with the DAS installation, and the INCHRON Tool-Suite.
For Infineon’s customers using external hardware trace solutions provided by iSYSTEM or Lauterbach, there is good news, too: The forementioned tools are supported by the INCHRON Tool-Suite right out of the box.

Discover What's Happening Inside
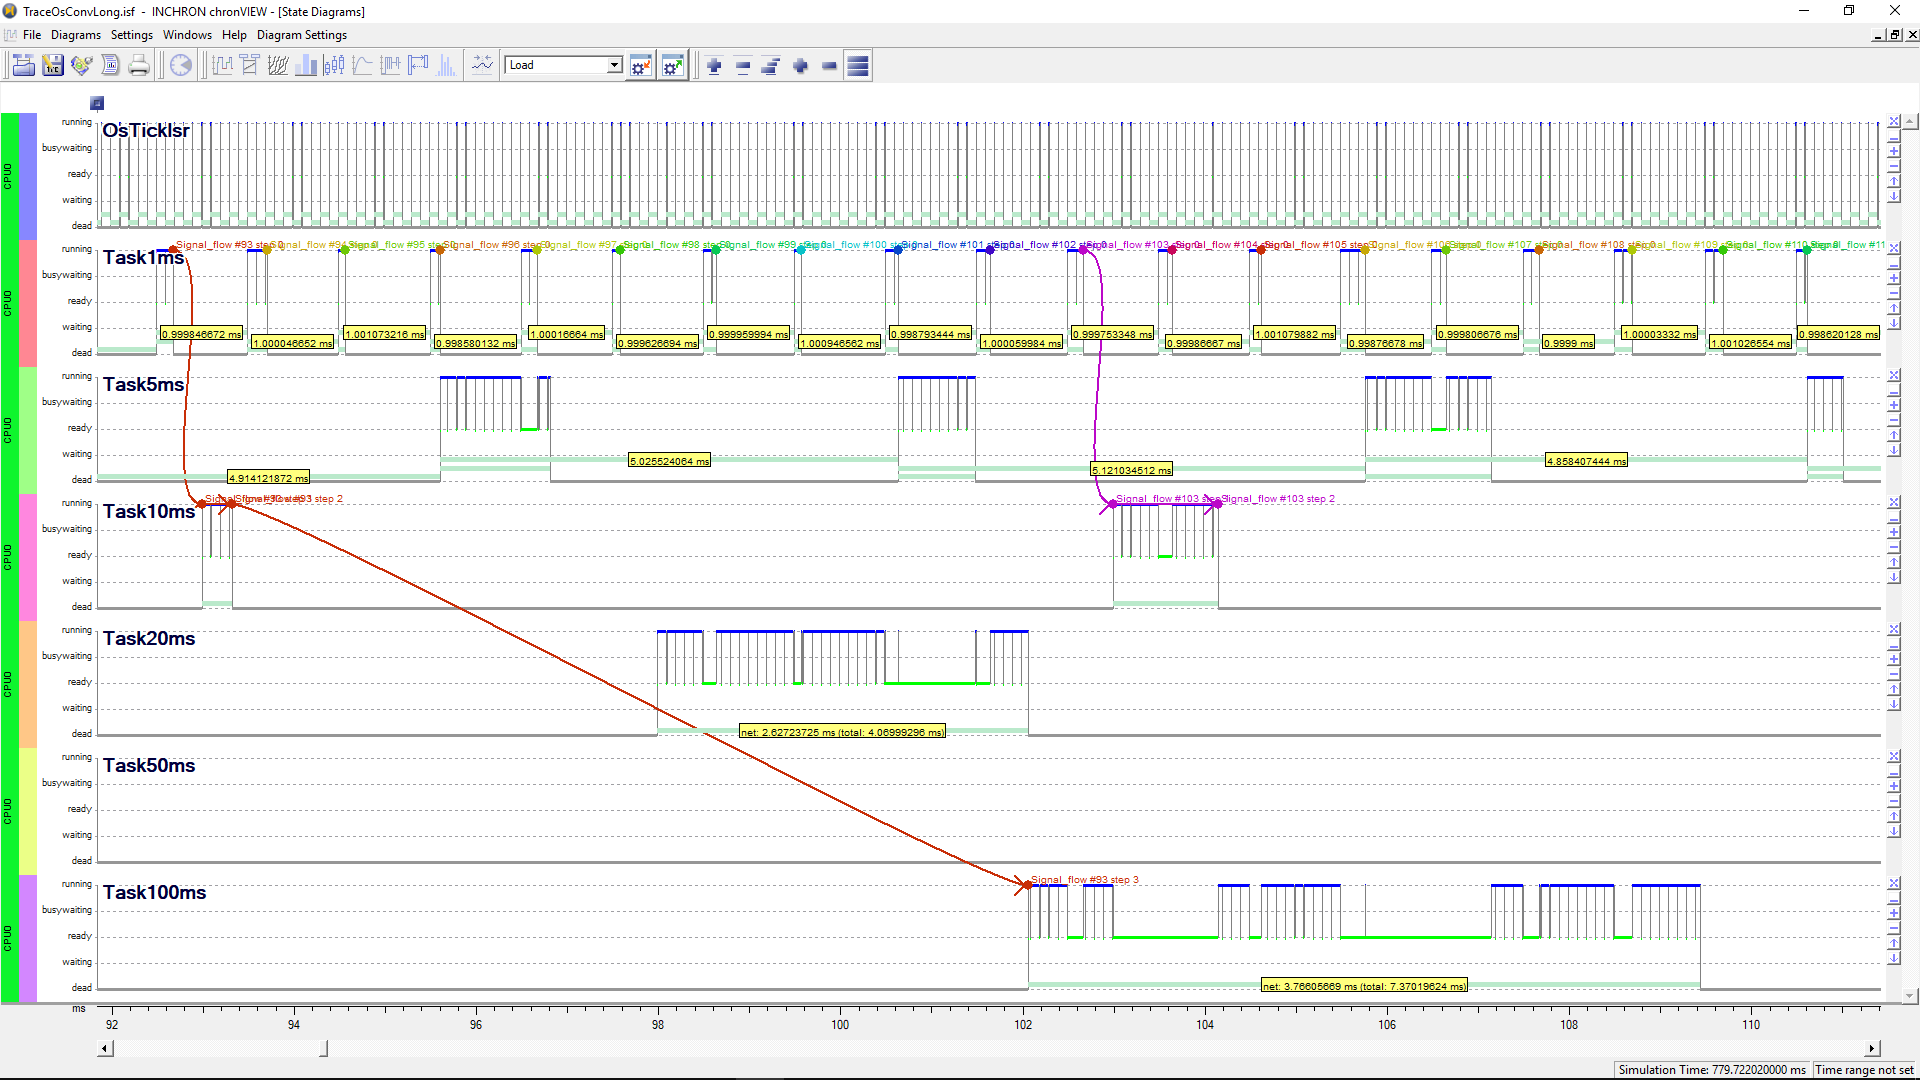
This screenshot shows a Gantt chart like graphical representation of a trace file recorded on AURIX. In this very simple scenario, there are several repetitive tasks running in parallel on AURIX, with preemption happening. Event chains are visualized by bended arrows.
This is just a simple, instructive example; there are a whole lot more views provided by the INCHRON Tool-Suite.
With lots of different views and a powerful graphics engine to support user-friendly manual analysis of real-time software behavior on Infineon’s AURIX platform, the INCHRON Tool-Suite is the ideal companion for issue analysis, documentation, training and cooperation among virtual teams.
Detect and Analyze Runtime Requirements Violations
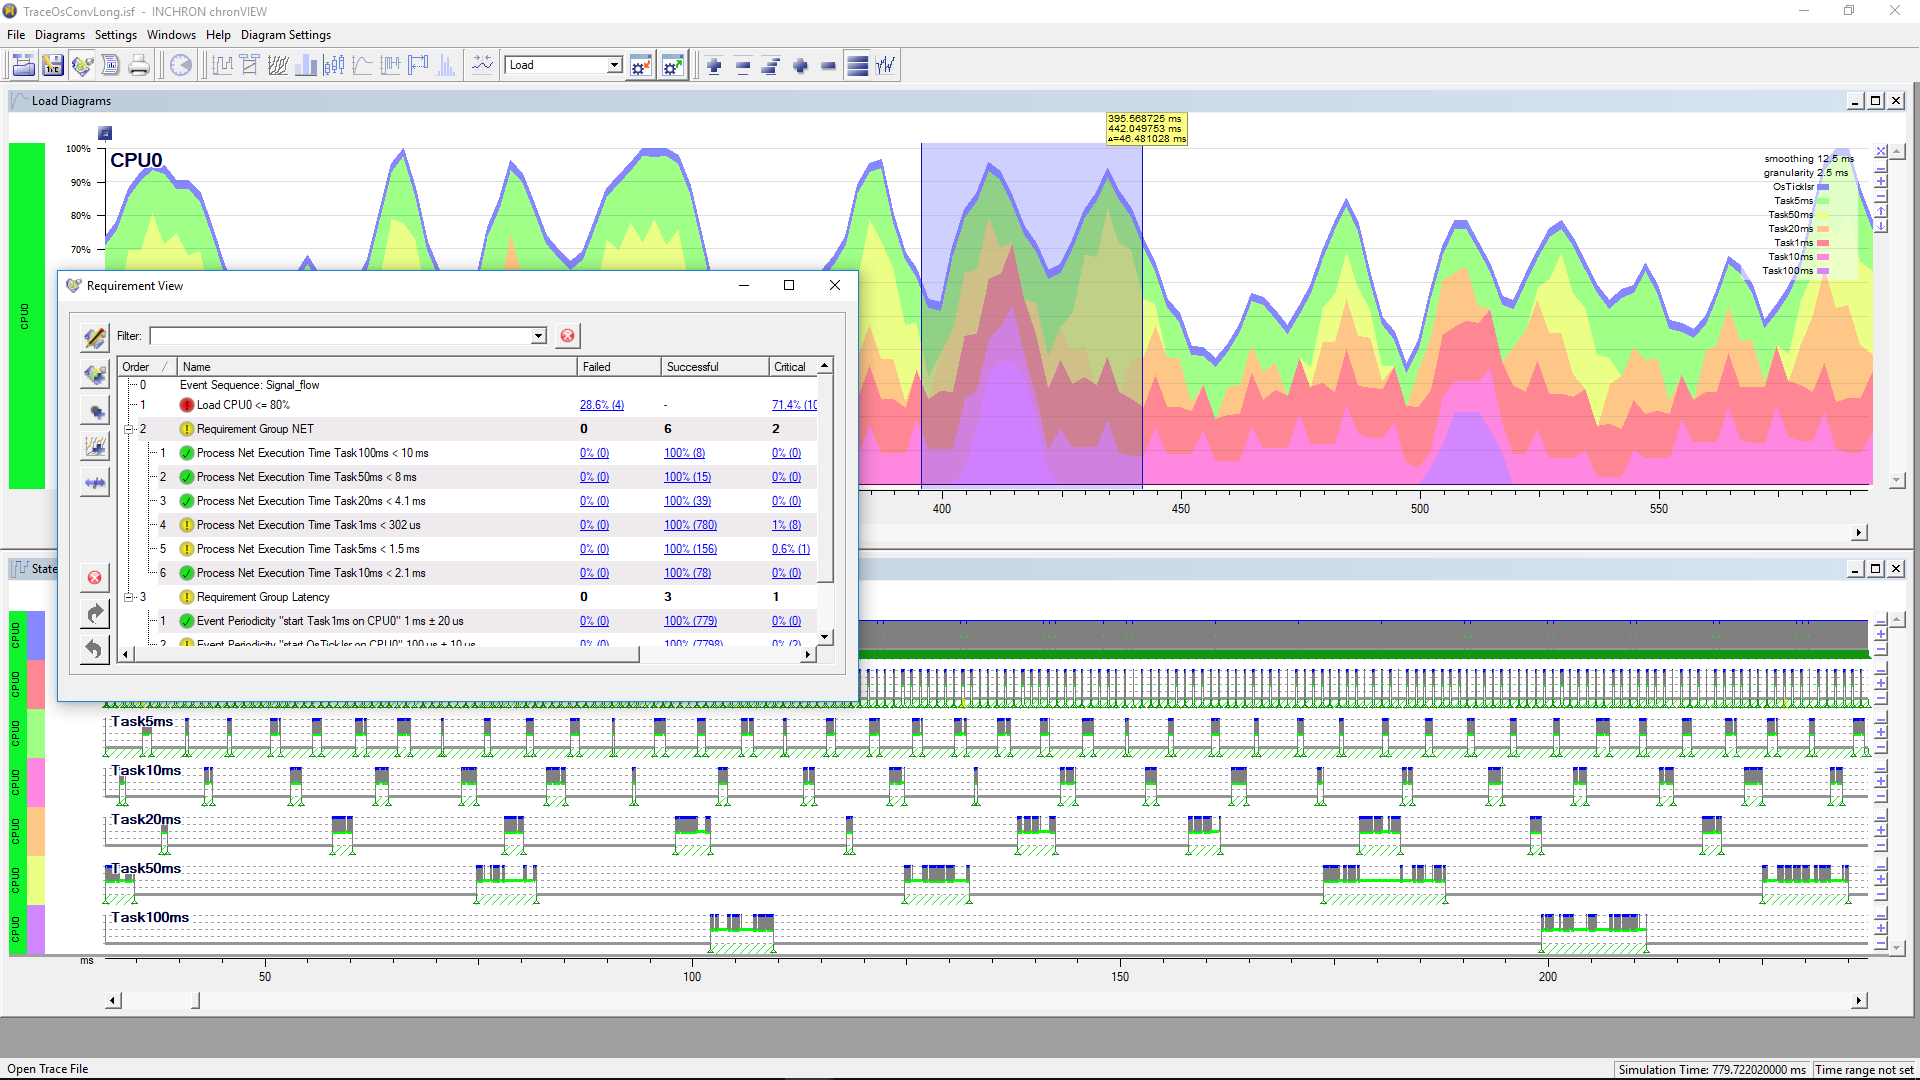
Based on a set of user-defined timing requirements, the INCHRON Tool-Suite analyzes the trace output and provides a wealth of statistical information. These results include traffic lights for each requirement, in order to highlight critical or near-to-critical run-time performance in red and yellow, respectively, thus guiding the user in focusing on critical aspects.
While there is a Gantt chart again in the lower half of this screenshot, the corresponding CPU load of the respective core is shown in the upper half. This is a user defined view that can be saved for later usage.
Dive Deep Into Your System's Real-Time Performance
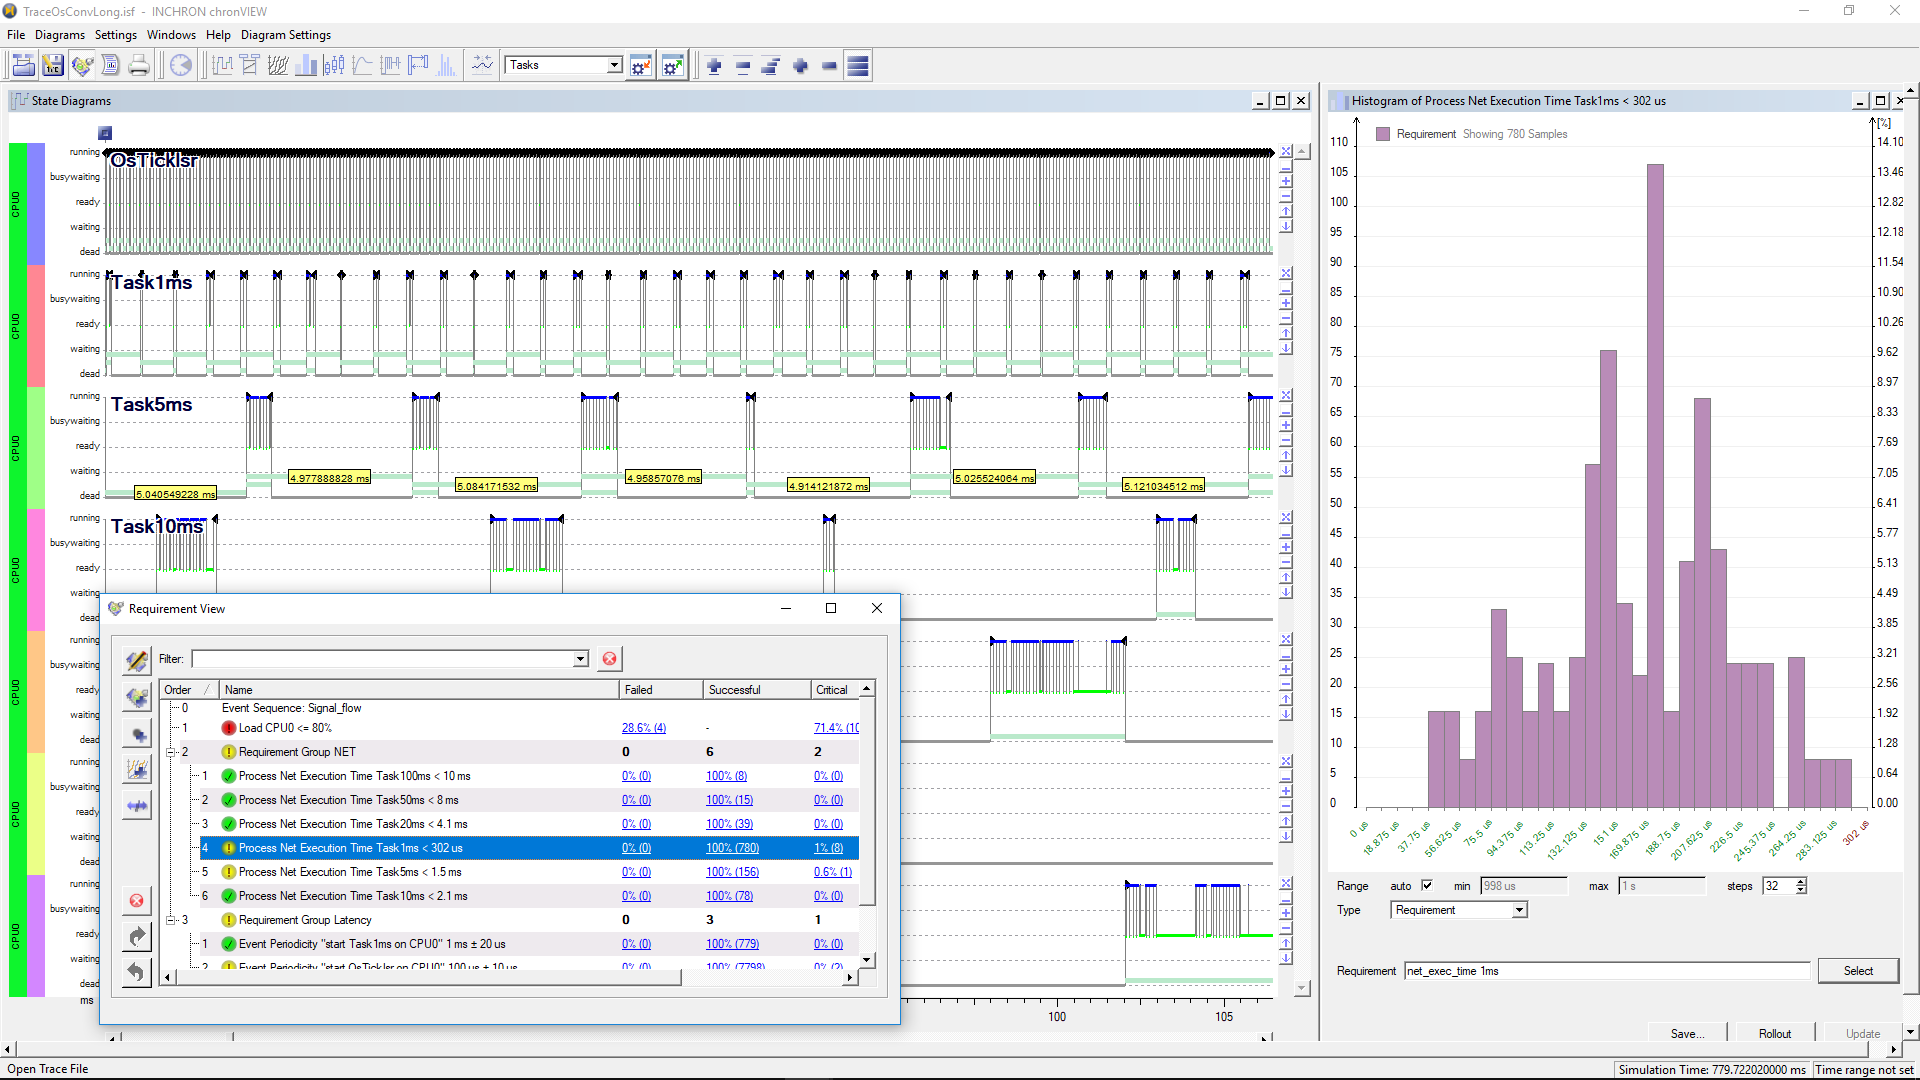
This is another example for a user-defined view, showing the Gantt chart and the requirement view, listing all requirements defined. On the right side, a bar chart visualizes the probability distribution of Task1ms net execution times measured in this particular example.
By specifying timing requirements and using the automated analysis capabilities of the INCHRON Tool-Suite, developers have a systematic and powerful method at hand to identify potential run-time performance issues, which quite often appear as “sporadic” issues that are exceptionally difficult to analyze and fix, if not monitored systematically.
We thank our partners Infineon and Tasking for supporting our live demo on the AURIX platform.
Real-Time Performance Analysis on Infineon AURIX
Download Presentation


