chronVIEW
Trace Visualization, Analysis, and Test

Visualize and analyze the imported traces of embedded systems and software. Verify timing requirements, quickly identify issues and create test reports.
For architects, developers, integrators, and testers.
Scalable Visualization and Analysis of Traces
chronVIEW offers a highly scalable solution for the visualization and statistical analysis of large hardware traces. It supports the import of data generated by instrumented code, debuggers, tracing tools, and proprietary solutions.
chronVIEW enables integration and test engineers to view and analyze recorded data from many different perspectives. Its automated verification of requirements, in combination with interactive diagrams, contributes to a better understanding of the overall system behavior and the root causes of real-time errors.
USE CASE
USE CASE
USE CASE
USE CASE
Key Features
- Visualization and interactive exploration of recorded trace data
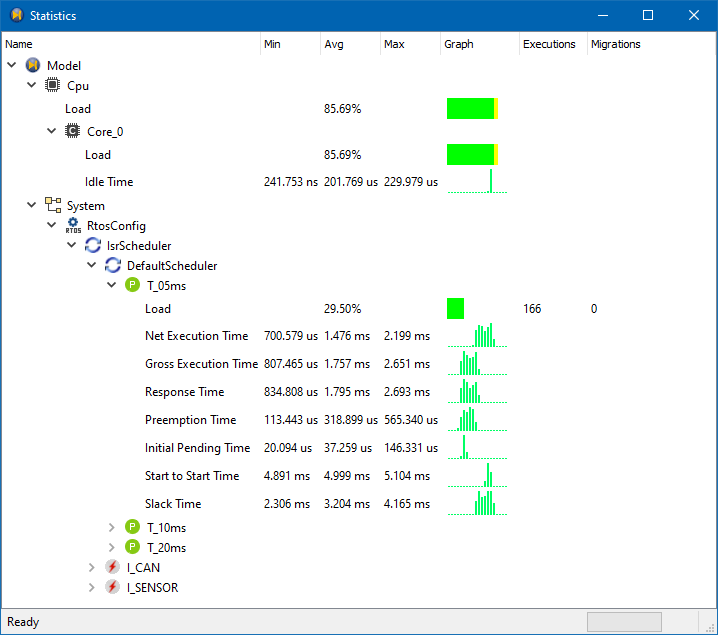
- Statistical analysis of timing and performance metrics
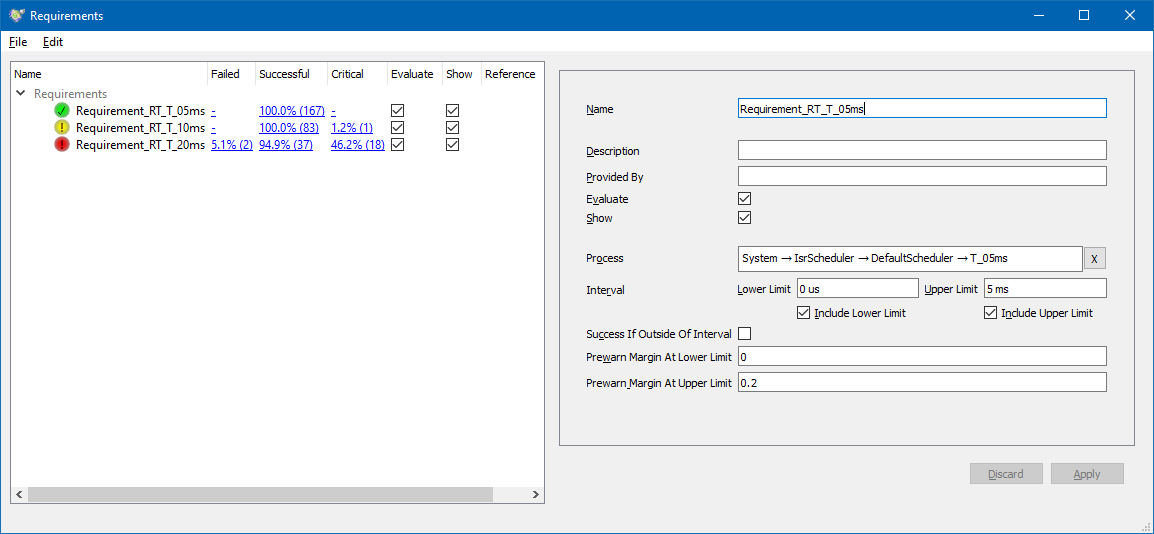
- Definition and automated verification of requirements
- Support of common tracing standards
- Import assistant for proprietary trace formats
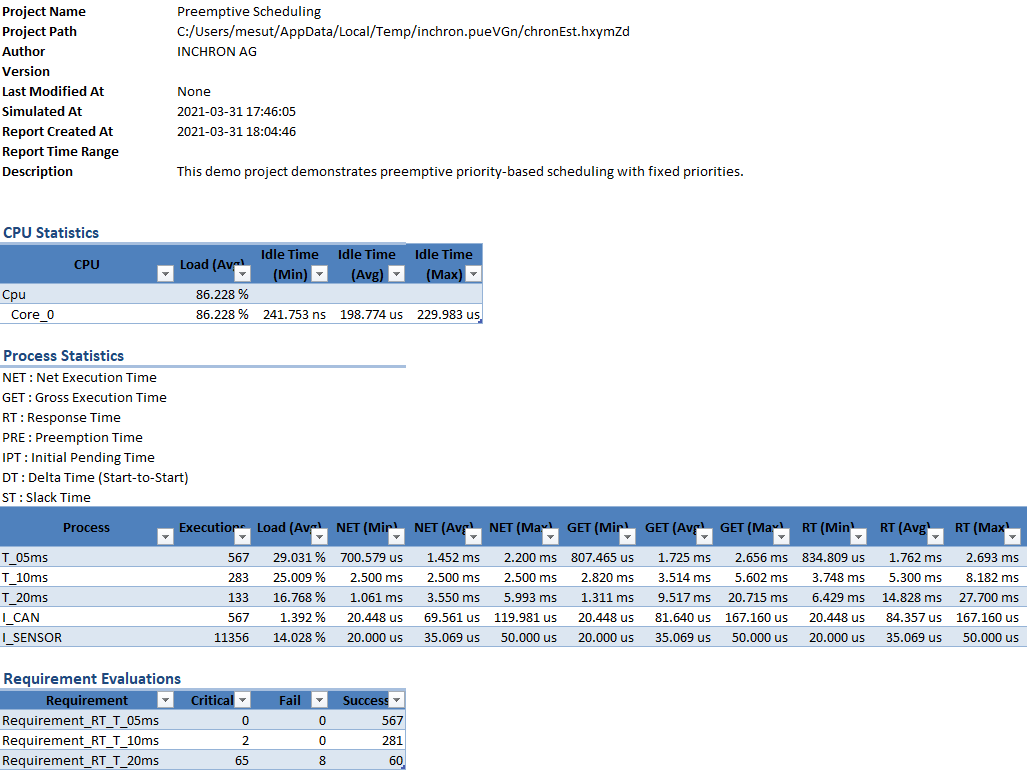
- Generation of result reports
- Workflow automation (Python, Batch / CLI, REST API)
“Up until now, we identified timing and performance problems only during series development. In the future, we will do this systematically right from the start – already in the concept phase.”
Bernhard Augustin, AUDI AG
Driver Assistance Systems
Trace Import
- Import of standard and third-party trace formats: ARTI, BTF, ETAS, Express Logic, Gliwa, Green Hills, iSYSTEM, Lauterbach, PLS, Vector, Windriver
- Intelligent wizard with built-in error detection, indication, and correction for proprietary trace formats
- Full support of multicore and multi-CPU traces including event chains and data variables
- Capable of handling very large traces
- Trace merge assistance
Trace Visualization and Analysis
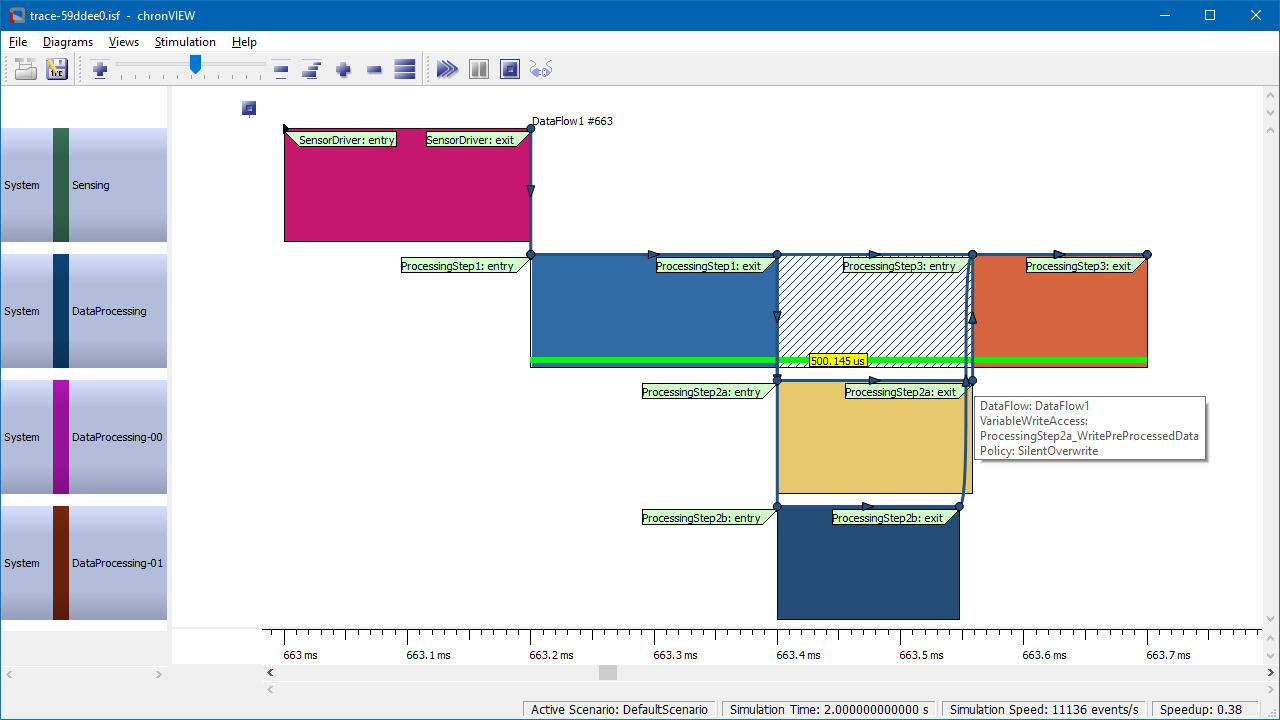
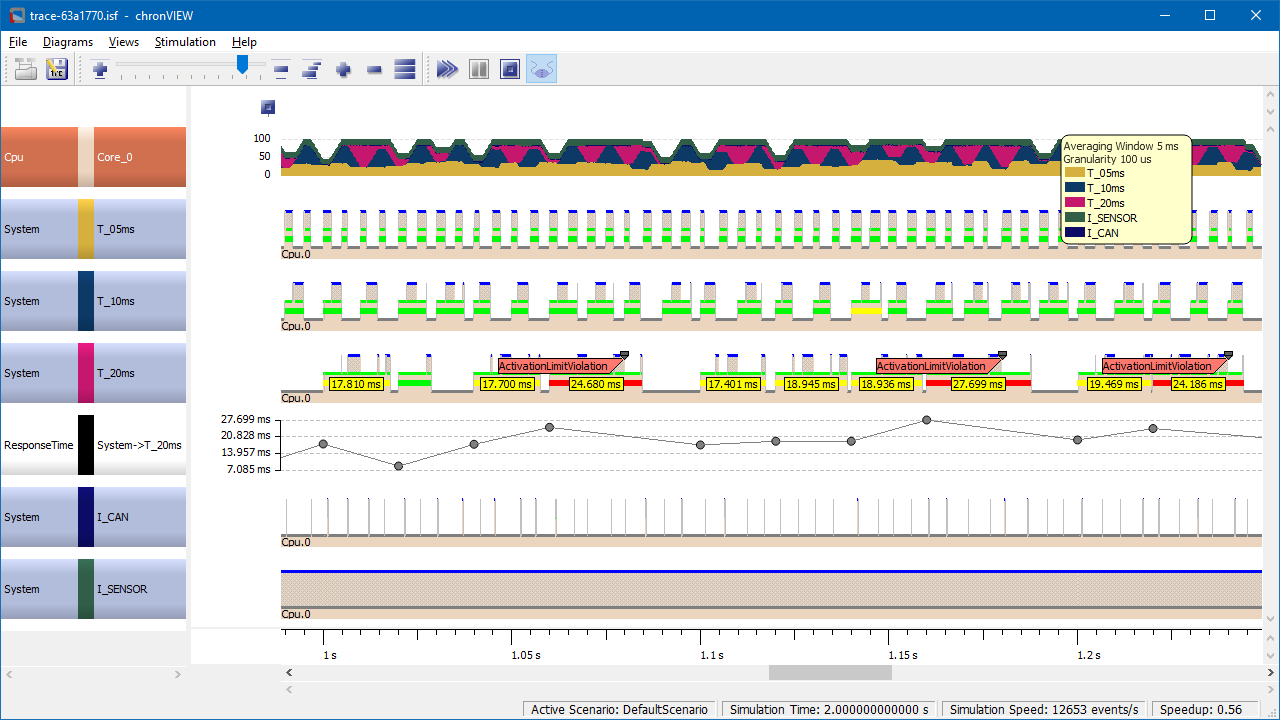
- Interactive trace view with a range of customizable diagrams and overlays for analyzing events, process state changes, resource utilization, etc.
- Visualization of RTOS scheduling, function nesting, data and control flow, user-defined events and event sequences, data values and rates, stack consumption, etc.
- Customizable time series diagrams for trace events, numerical values, and process execution metrics
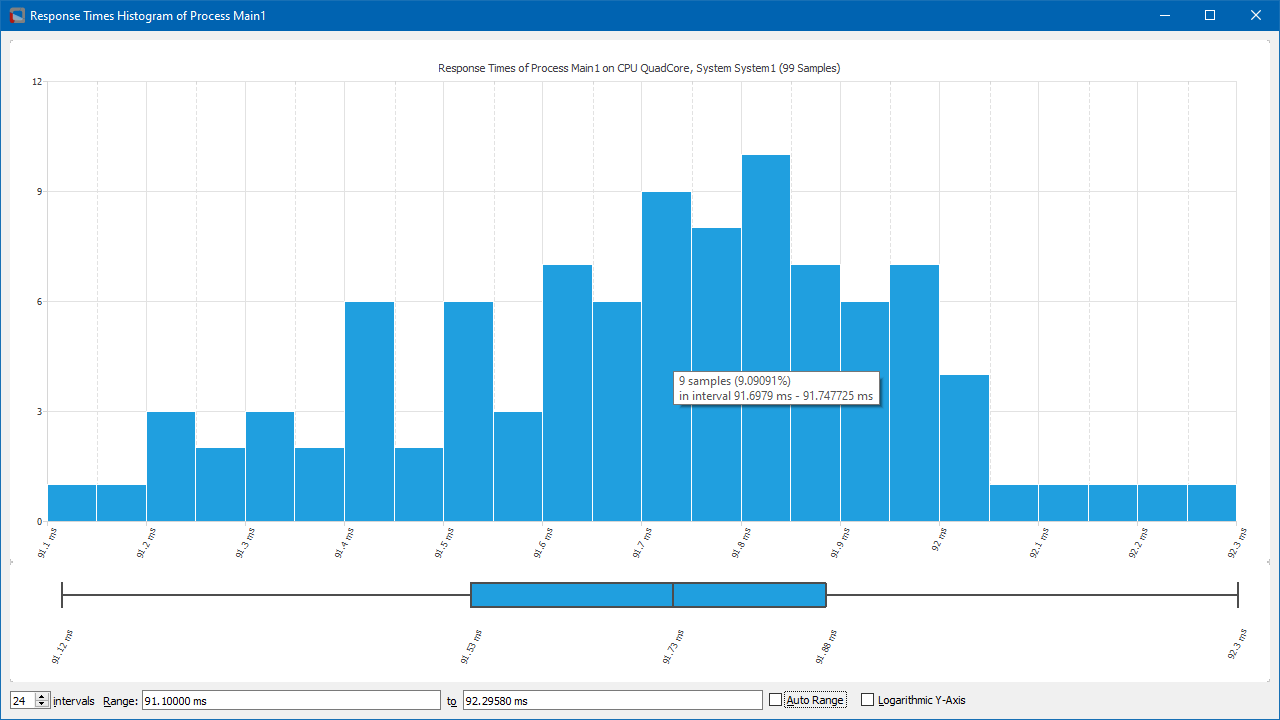
- Histograms and box plots of timing metrics
- Extensive statistical analysis and data extraction options
Verification of Requirements
- Specification of timing and performance requirements according to the ASAM ARTI standard
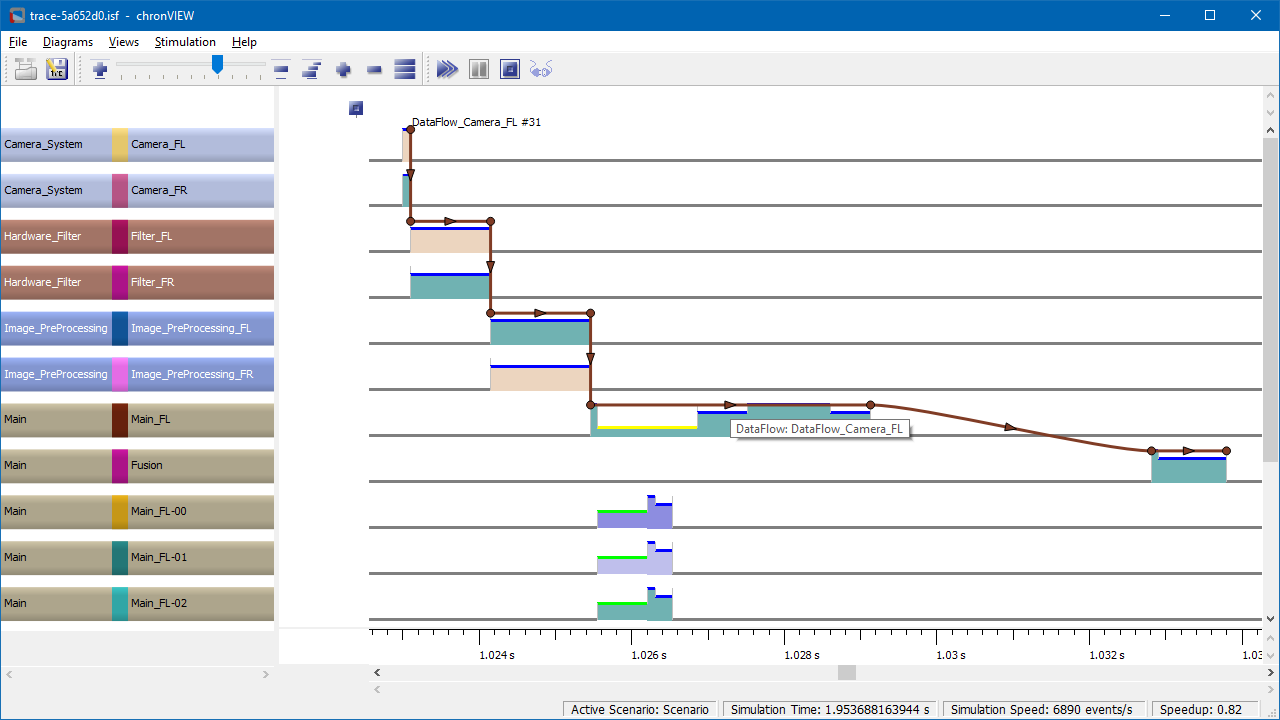
- Specification of end-to-end event chains for ADAS and AD applications
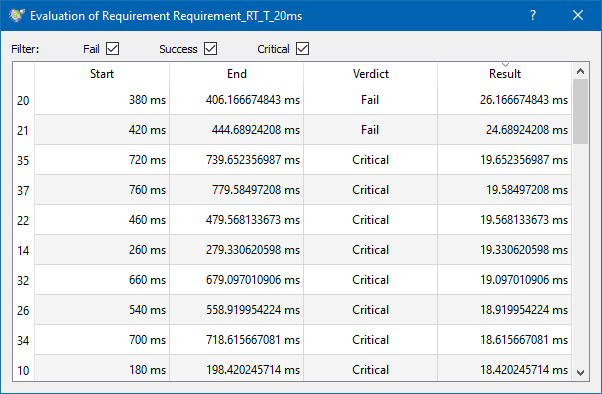
- Automated verification and generation of result reports
- Continuous traceability of requirements (e.g. for IBM DOORS)
- Customized requirement evaluations using metric framework … read more
Reporting
- Report generation with fully customizable templates
- CSV / Excel, HTML, PDF formats supported
- Framework for accessing evaluation results … read more
Automation
- Automated model generation for simulation and analysis
- Workflow automation (Python, Batch / CLI, REST API)
- Using chronVIEW in a cloud environment … read more
“INCHRON enables Valeo to start validation of our architectural designs at the logical level, facilitating identification of potential problems during the earliest stages of development. This allows us to define the integration requirements for derived projects and ensure correct timing behavior.”
Frieder Heckmann, Valeo Schalter und Sensoren GmbH
System Architect
Selected Customers





Questions We Can Answer Right Away…
Does chronVIEW supports event chain analysis?
Yes. chronVIEW visualizes event chains steps at the granularity level of processes or functions. Requirements are evaluated automatically.
Does chronVIEW support QNX, Linux, POSIX, and AUTOSAR adaptive platform?
Yes. chronVIEW allows in-depth analysis of dynamic behavior based on RTOS-aware trace files with process and function execution information.
Can chronVIEW be automated?
Yes. chronVIEW can be automated with a batch mode / command-line interface. It can be used on Windows or Linux, on a desktop PC or server, and in a cloud environment. Full headless operation is also supported. It integrates with tools like Jenkins, Microsoft Azure, and many more.
Can I use the same requirement specification as in chronSIM?
Yes. Requirement specifications can be exported from chronSIM and imported into chronVIEW.
Are there any restrictions regarding the size of trace files?
chronVIEW has no restrictions of its own. It is only limited by the available RAM and memory.
Can I use chronVIEW to analyze changes in data over time?
Yes. chronVIEW’s main use case is the analysis and visualization of time-series data such as sensor signals, RTOS events, process states, or protocol data on a bus.
Is it possible to merge the traces of several ECUs?
Yes. In order to analyze a distributed system, traces can be merged and synchronized against a single reference time base.
Do I need tracing hardware?
chronVIEW expects a trace as its input. It supports various standard and 3rd party trace formats but does not include the functionality of a hardware tracing solution.
Infineon’s Multi-Core Debug Solution (MCDS) is directly supported and can be used without additional tracing hardware.

